Latest Version
Version
1.1.5
1.1.5
Update
January 23, 2025
January 23, 2025
Developer
shubhlaxmi
shubhlaxmi
Categories
Finance
Finance
Platforms
Android
Android
Downloads
0
0
License
Free
Free
Package Name
com.shubhlaxmi.nsestockstrengthmeter
com.shubhlaxmi.nsestockstrengthmeter
Report
Report a Problem
Report a Problem
More About Stock 50 Strength Meter
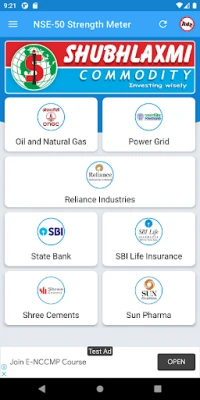
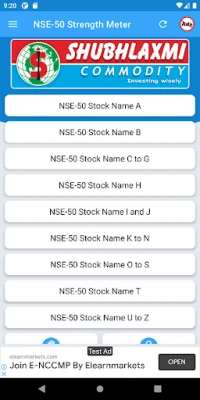
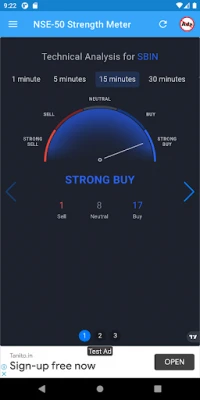
This is a simple app in which you can check First Nse Stock 50 Stock strength for different timeframes using the TradingView Strength Meter widget. All the Nifty 50 Stocks are included. All you have to do is select the Stock, select the time frame and Real-Time Stock Live Rate and Stock Charts without any tools and 3 Type of Support & Resistance Levels
The stock market strength indicator screen of the Trading meter app shows the strength and weakness of the stock in meter format. The Trading meter's pointer extreme high indicates the Strong Buy signal and extreme low indicates the Strong Sell signal.
The app contains :
* Stock 50 Strength Meter
* Index Future Charts
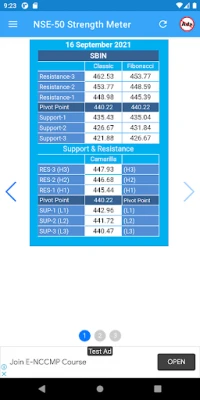
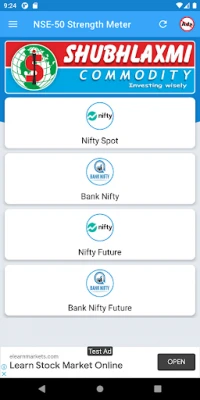
* Nifty Index Live Chart and Support & Resistance Levels
* Nifty Index Future Live Chart and Support & Resistance Levels
* India ViX Chart India volatility index
* US Dollar Index Chart
* Bank Nifty Live Chart and Support & Resistance Levels
* Bank Nifty index Future Live Chart and Support & Resistance Levels
* International World Market Live Price
* NSE 50 Stocks 3 Type Support & Resistance Levels
1) Classic Pivot
2) Fibonacci Pivot
3) Camarilla Levels
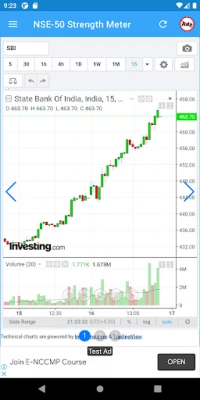
* Real-Time Nse First 50 Stock Live Rate
* Real-Time Nse First 50 Stock Charts without any tools
* International Index Live
Rate the App
Add Comment & Review
User Reviews
Based on 0 reviews
No reviews added yet.
Comments will not be approved to be posted if they are SPAM, abusive, off-topic, use profanity, contain a personal attack, or promote hate of any kind.
More »


Popular Apps

Santander Empresas ARBanco Santander (Argentina)

UFCU Mobile 5UFCU

Santander Inversiones Uruguay 5Banco Santander Uruguay

Santander Empresas Portugal 5Banco Santander Totta S.A.

Santander mobileSantander Bank Polska S.A.
Mi Tarjeta SantanderBanco Santander Uruguay

Santander ArgentinaBanco Santander (Argentina)

Santander EmpresasBanco Santander (Brasil) S.A.

Santander BrasilBanco Santander (Brasil) S.A.

Santander Way: App de cartõesBanco Santander (Brasil) S.A.
More »


Editor's Choice

Grim Soul: Dark Survival RPG 5Brickworks Games Ltd

Craft of Survival - Gladiators 5101XP LIMITED

Last Shelter: Survival 5Long Tech Network Limited

Dawn of Zombies: Survival GameRoyal Ark

Merge Survival : Wasteland 5StickyHands Inc.

AoD Vikings: Valhalla Game 5RoboBot Studio

Viking Clan: Ragnarok 5Kano Games

Vikings: War of Clans 5Plarium LLC

Asphalt 9: Legends 5Gameloft SE

Modern Tanks: War Tank Games 5XDEVS LTD

