Latest Version
Version
1.15
1.15
Update
November 20, 2024
November 20, 2024
Developer
Septudio LLC
Septudio LLC
Categories
Tools
Tools
Platforms
Android
Android
Downloads
0
0
License
Free
Free
Package Name
com.winboxmobile4
com.winboxmobile4
Report
Report a Problem
Report a Problem
More About Mikrotik Tool Winbox Mobile
•Support Mikrotik RouterOS v6 and RouterOS v7. Connect with api/api-ssl.
•Port Knocking. Minimize a risk of hacking attempts. Enable with one-tap.
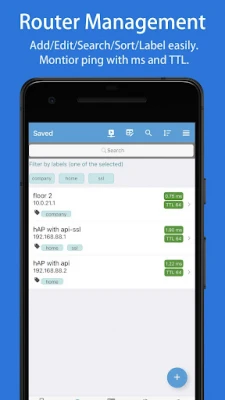
•Group routers by labels. Search routers by name, ip/url, or labels.
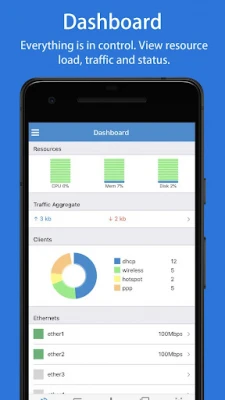
•Dashboard with resources usage, cpu, memory and disk. Traffic throughput, client count and percentage chart. Ethernet status.
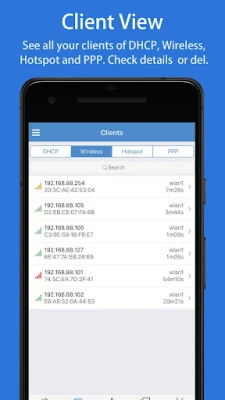
•Clients view shows main clients of the router, DHCP lease, Wireless registration, Hotspot active and PPP active. Check the details and control.
•Interfaces view shows realtime tx/rx rate of interfaces.
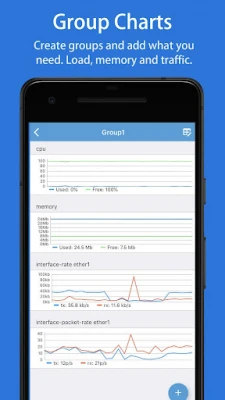
•Create chart groups and add what you need. For example, create a group with cpu usage, memory usage, ether1 traffic rate and wlan traffic rate.
•Router settings. Support CAPsMAN, interfaces, wireless, bridge, switch, mesh, PPP, IP, routing, system, queues, radius.
•Live Statistics data and charts for wlan clients, simple queues and firewall rules/nat/mange/raw.
•Batch update. Select items then enable, disable or delete. Easily select all and clear.
•View router logs and search.
•Tools. Ping, Traceroute, Ip Scan, Bandwidth Test and Profile.
•Run scripts, Shutdown/Reboot router.
•Files, backup and restore.
•Check for updates.
•Easy to use. Pull to refresh, search highlight, sort list items and drag to reorder.
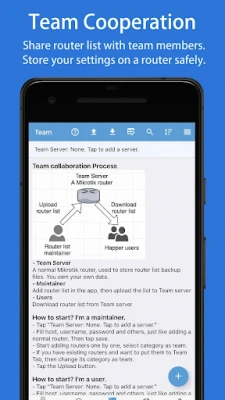
•Team Collaboration. Share and maintain router lists efficiently within a team.
...............
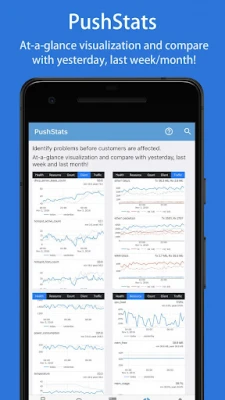
PushStats. Monitor stats and identify problems before customers are affected.
- Health. voltage, current, power consumption, temperature, cpu temperature, fan speed.
- Resources. uptime, cpu load, memory usage, hdd space usage.
- Counts. system active user, bridge host, ip arp, firewall connection, ipsec remote peer, ipsec policy, ip pool used, ip route, bgp peer, ospf neighbor.
- Client Counts. capsman registration, capsman remote cap, capsman radio, wireless registration, ppp active, dhcp server lease, hotspot active, hotspot host, hotspot cookie.
- Traffic. tx/rx rate and packet rate for aggregate, ethernet and wlan interface.
- Events. Generating alerts when no push stats received, cpu usage exceeds 90%, memory usage exceeds 90%, the traffic of interface become zero and more.
...............
Free Features
•LAN scan. Saved one router.
•Dashboard with resources usage, cpu, memory and disk, traffic throughput.
•Client count and percentage chart. Ethernet status and details.
•Clients view with DHCP client list and details.
•Latest tx/rx rate of five Interfaces.
•Enable PushStats, at-a-glance visualization and compare with yesterday.
•Group Chart with cpu usage, memory usage and main interface rate.
•View router logs and search.
•Shutdown/Reboot router, upgrade router.
Rate the App
Add Comment & Review
User Reviews
Based on 0 reviews
No reviews added yet.
Comments will not be approved to be posted if they are SPAM, abusive, off-topic, use profanity, contain a personal attack, or promote hate of any kind.
More »


Popular Apps

Santander Inversiones Uruguay 5Banco Santander Uruguay

Santander Empresas Portugal 5Banco Santander Totta S.A.
Mi Tarjeta SantanderBanco Santander Uruguay

Santander ArgentinaBanco Santander (Argentina)

Santander Empresas ARBanco Santander (Argentina)
Santander EmpresasBanco Santander (Brasil) S.A.

SantanderSignSantander Consumer Bank AG (Deutschland)

Santander mobileSantander Bank Polska S.A.

Santander InternationalSantander International

Santander Way: App de cartõesBanco Santander (Brasil) S.A.
More »


Editor's Choice

Grim Soul: Dark Survival RPG 5Brickworks Games Ltd

Craft of Survival - Gladiators 5101XP LIMITED

Last Shelter: Survival 5Long Tech Network Limited

Dawn of Zombies: Survival GameRoyal Ark

Merge Survival : Wasteland 5StickyHands Inc.

AoD Vikings: Valhalla Game 5RoboBot Studio

Viking Clan: Ragnarok 5Kano Games

Vikings: War of Clans 5Plarium LLC

Asphalt 9: Legends 5Gameloft SE

Modern Tanks: War Tank Games 5XDEVS LTD

