Latest Version
Version
1.0.4
1.0.4
Update
November 10, 2024
November 10, 2024
Developer
Antonixio
Antonixio
Categories
Tools
Tools
Platforms
Android
Android
Downloads
0
0
License
Free
Free
Package Name
com.antonixio.bar_chart_maker
com.antonixio.bar_chart_maker
Report
Report a Problem
Report a Problem
More About Bar Chart Maker
Key Features:
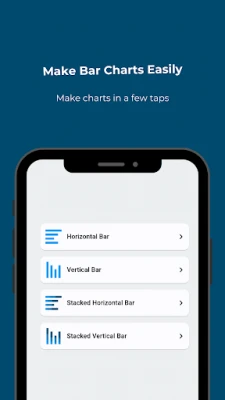
1. Vertical Bar Charts: Create vertical bar charts effortlessly to represent your data in a clear and organized manner. Choose from various customization options to tailor the chart to your needs.
2. Horizontal Bar Charts: For a different perspective, opt for horizontal bar charts, perfect for comparing data points horizontally.
3. Stacked Vertical Bar Charts: Visualize multiple datasets simultaneously using stacked vertical bar charts. This feature helps you explore the composition of various data categories within a single chart.
4. Stacked Horizontal Bar Charts: Similar to stacked vertical charts, this feature enables you to display stacked data in a horizontal format, making it easier to showcase data relationships.
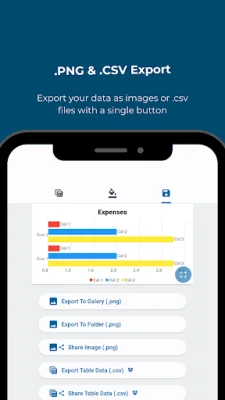
5. Export as Image: Turn your chart into a high-quality image with just a few clicks. Share your charts in reports, presentations, or online with ease.
6. Export Data as .CSV: Seamlessly export your data as a .csv file for further analysis or sharing with colleagues, ensuring your insights are accessible to everyone.
7. Simple UI: Our user-friendly interface is designed for users of all levels, making it easy to navigate and create beautiful charts without any technical expertise.
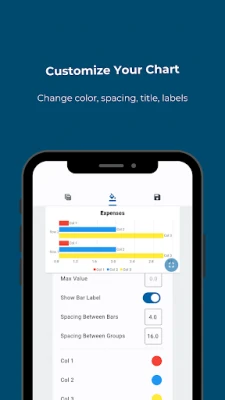
8. Chart Customization: Tailor your charts to match your unique style and requirements. Customize colors, labels, titles, and more to create the perfect visual representation of your data.
Rate the App
Add Comment & Review
User Reviews
Based on 0 reviews
No reviews added yet.
Comments will not be approved to be posted if they are SPAM, abusive, off-topic, use profanity, contain a personal attack, or promote hate of any kind.
More »


Popular Apps
Santander Inversiones Uruguay 5Banco Santander Uruguay

Santander Empresas Portugal 5Banco Santander Totta S.A.
Mi Tarjeta SantanderBanco Santander Uruguay

Santander Empresas ARBanco Santander (Argentina)

Santander ArgentinaBanco Santander (Argentina)

Santander EmpresasBanco Santander (Brasil) S.A.

SantanderSignSantander Consumer Bank AG (Deutschland)

Santander mobileSantander Bank Polska S.A.

Santander InternationalSantander International

UFCU Mobile 5UFCU
More »


Editor's Choice

Grim Soul: Dark Survival RPG 5Brickworks Games Ltd

Craft of Survival - Gladiators 5101XP LIMITED

Last Shelter: Survival 5Long Tech Network Limited

Dawn of Zombies: Survival GameRoyal Ark

Merge Survival : Wasteland 5StickyHands Inc.

AoD Vikings: Valhalla Game 5RoboBot Studio

Viking Clan: Ragnarok 5Kano Games

Vikings: War of Clans 5Plarium LLC

Asphalt 9: Legends 5Gameloft SE

Modern Tanks: War Tank Games 5XDEVS LTD

