Latest Version
Version
2.0
2.0
Update
November 29, 2024
November 29, 2024
Developer
Sona_Creation
Sona_Creation
Categories
Finance
Finance
Platforms
Android
Android
Downloads
0
0
License
Free
Free
Package Name
com.books.chartpatternhindipdf
com.books.chartpatternhindipdf
Report
Report a Problem
Report a Problem
More About Chart Pattern Hindi - PDF
Good App For Chart Pattern Hindi - PDF
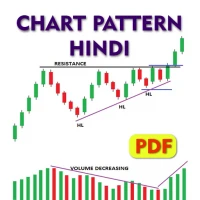
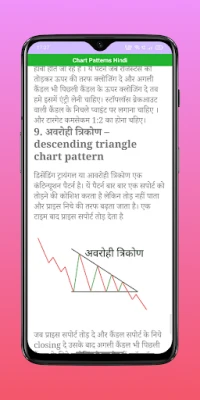
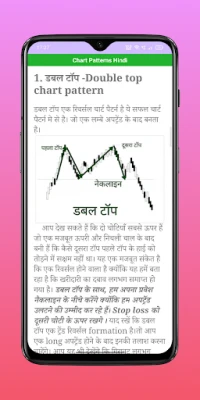
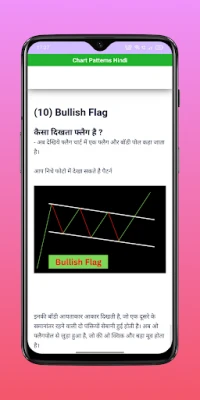
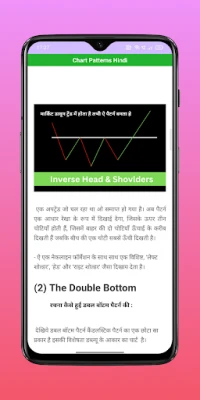
A chart pattern or price pattern is a pattern within a chart when prices are graphed. In stock and commodity markets trading, chart pattern studies play a large role during technical analysis. When data is plotted there is usually a pattern which naturally occurs and repeats over a period.
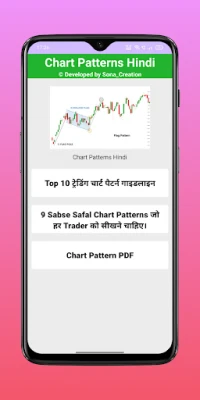
In This App
1. What is the chart pattern?
A chart pattern is a graphical presentation of price movement by using a
series of trend lines or curves. Chart patterns can be described as a
natural phenomenon of fluctuations in the price of a financial asset that is
caused by a number of factors, including human behavior.
2. What are the uses of chart patterns?
A chart pattern is simply a specific formation on a chart that can be
viewed as a trading signal, or as an indication of future price movements.
Traders who employ charts – also called “chartists” - use chart patterns to
identify trends and reversals and to decide whether they should buy, sell or
wait.
3. What are the different types of chart patterns?
How many types of chart patterns are there? There are three key chart
patterns used by technical analysis experts. These are traditional chart
patterns, harmonic patterns and candlestick patterns (which can only be
identified on candlestick charts).
4. What are the advantages of chart patterns?
Chart patterns are useful technical tools to understand why an asset price
has behaved in a certain way. These are indicative of market support and
resistance level, helping traders to open a long or short position. Stock
chart patterns are used to study market movement and manage risk-
reward situations.
Developed by: Sona_Creation
Contact Us:[email protected]
HASTA LA VISTA
Rate the App
Add Comment & Review
User Reviews
Based on 0 reviews
No reviews added yet.
Comments will not be approved to be posted if they are SPAM, abusive, off-topic, use profanity, contain a personal attack, or promote hate of any kind.
More »


Popular Apps
Santander Inversiones Uruguay 5Banco Santander Uruguay

Santander Empresas Portugal 5Banco Santander Totta S.A.
Mi Tarjeta SantanderBanco Santander Uruguay

Santander Empresas ARBanco Santander (Argentina)

Santander ArgentinaBanco Santander (Argentina)

Santander EmpresasBanco Santander (Brasil) S.A.

Santander mobileSantander Bank Polska S.A.
SantanderSignSantander Consumer Bank AG (Deutschland)

UFCU Mobile 5UFCU

Santander InternationalSantander International
More »


Editor's Choice

Grim Soul: Dark Survival RPG 5Brickworks Games Ltd

Craft of Survival - Gladiators 5101XP LIMITED

Last Shelter: Survival 5Long Tech Network Limited

Dawn of Zombies: Survival GameRoyal Ark

Merge Survival : Wasteland 5StickyHands Inc.

AoD Vikings: Valhalla Game 5RoboBot Studio

Viking Clan: Ragnarok 5Kano Games

Vikings: War of Clans 5Plarium LLC

Asphalt 9: Legends 5Gameloft SE

Modern Tanks: War Tank Games 5XDEVS LTD
